


The Insights You
Need
are Right Here
VISASQ/COLEMAN was established in 2021
as a partnership between
Asia’s top expert
network firm, VisasQ Inc. and Coleman
Research, a trusted
expert service provider
with more than 20 years of global
experience.
What We Do
Our goal is to provide global leaders and business investors with the expertise needed to make better decisions.
There are barriers to knowledge and our mission is to remove them – with a global platform for the direct and rapid exchange of critical insights.

Why Our Clients Choose
VISASQ/COLEMAN

Precise Custom
Recruitment

Targeted custom recruitment is a fundamental element of our service. Approximately 20% of our experts on any given projects are custom sourced.

Unique
Network

A dynamic and expanding network of global thought-leaders and experts, hand-selected for over 20 years, with exceptional depth in Japan and the United States.
Industry-Leading
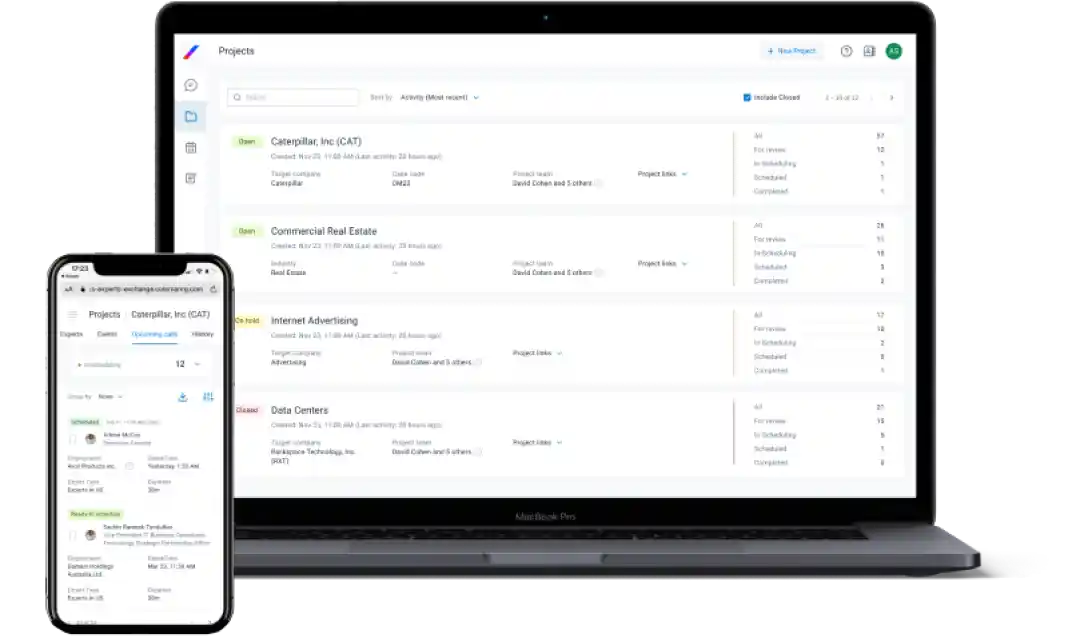
Client App
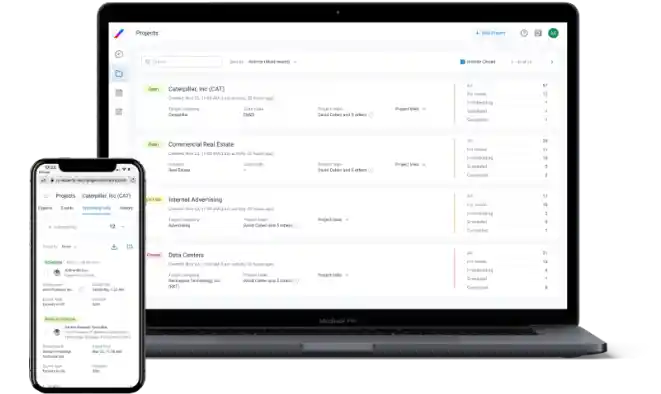
A clear and simple UI enables straightforward project submission, while our UX supports instant expert reviews, as well as consultation scheduling and hosting.
Rapid Expert
Scheduling

7 offices across the US, EMEA, and APAC working 24/5. Average custom recruiting time is less than 24 hours. In-network experts can be scheduled in less than an hour.

Robust Compliance
Framework

A fully customizable platform makes firm-specific compliance protocols easy to implement and manage. Utilization and interactions can be easily reviewed via our Compliance App.
How We Work
Our teams work hard to understand your investment and research objectives, so we can provide you with the tools and services to quickly connect you to the right experts.
Bespoke online or in-person consultations with a qualified VISASQ/COLEMAN expert for in-depth insights.
- Idea generation
- Channel checks
- Broaden industry knowledge
- Qualitative verification of hypotheses
Mini-surveys, quickly administered, provide fast answers to questions from multiple experts.
-
Quick, quantitative verification of hypothesis (possibly before or
after 1:1 calls) - Initial market/industry research
Customizable questionnaires that can be shared with VISASQ/COLEMAN experts to deliver accurate data you can trust.
- Broader, quantitative verification of hypotheses (possibly before or after 1-on-1 Consultations)
- Transcripts
- Additional Research
- Moderated Calls
- Deal Placements
Case Studies
Learn how companies around the globe use VisasQ/Coleman to get the relevant insights they need to make better business decisions.


US Private Equity Firm Researching new Wireless Communications Company in Asia

Targeted Research Enables Hedge Fund to Uncover Advertising Trends in Social Media Industry

Major U.S. Corporation Partners with VISASQ/COLEMAN to Survey Experts Outside of Its Internal Network